COMS 4995 Advanced Systems Programming
Interrupts
Processor Modes
CPU runs with a privilege mode that determines what kind of operations it can perform:
- User mode: cannot perform privileged operations or directly access hardware
- Kernel mode: can perform privileged operations and has full access to hardware
A userspace program (running in user mode) can issue a syscall (e.g. read())
to enter kernel mode so that it can perform a privileged operation (e.g. issue
I/O request).

Syscalls act as predefined entry-points into the kernel. They allow userspace programs to “trap” into the kernel to perform a privileged operation and then “return-from-trap” back to user mode.
User-invoked syscalls aren’t the only way for the kernel to gain control of the system. There are many instances where the kernel must gain control regardless of what the user program is doing.
Interrupts
Interrupts are a mechanism that stops the CPU from executing the current stream of instructions and makes it jump to a predetermined piece of OS kernel code to perform certain tasks.
There are three classes of interrupts:
- Hardware interrupts
- asynchronous (i.e., can arrive at any time, regardless of what the CPU is doing)
- e.g., network packet arrival, timer interrupts, key press, mouse click
- Hardware clock will periodically deliever timer interrupts. The OS kernel can use these to determine if a process has run for too long and possibly perform a context switch to another process.
- Exceptions & Faults
- synchronous – they happen as a result of executing some instruction
- e.g., dividing by zero, segmentation fault, page fault
- Software interrupts
- synchronous – program code explicitly raising an interrupt
- x86
int <code>instruction: raise software interrupt- x86-32 system call:
int 0x80(see syscall dispatch section below) - Debugger software breakpoints:
int3(see breakpoint section below)
- x86-32 system call:
The psuedocode below demonstrates how the CPU handles interrupts while executing instructions:
while (1) {
    if (interrupt or exception) {
        n = interrupt/exception type
        call interrupt handler n
    }

    fetch next instruction
    if (instruction == int n)
        call interrupt handler n
    else
        run instruction
}
Note: do not confuse interrupts with userspace signals!
- Signals: enables communication between processes and OS
- Interrupts: enables communication between hardware and OS
- but some interrupts can generate userspace signals…
- divide by zero exception:
SIGFPE - illegal memory access:
SIGSEGV - software breakpoint:
SIGTRAP
- divide by zero exception:
- but some interrupts can generate userspace signals…
Linux System Call Dispatch
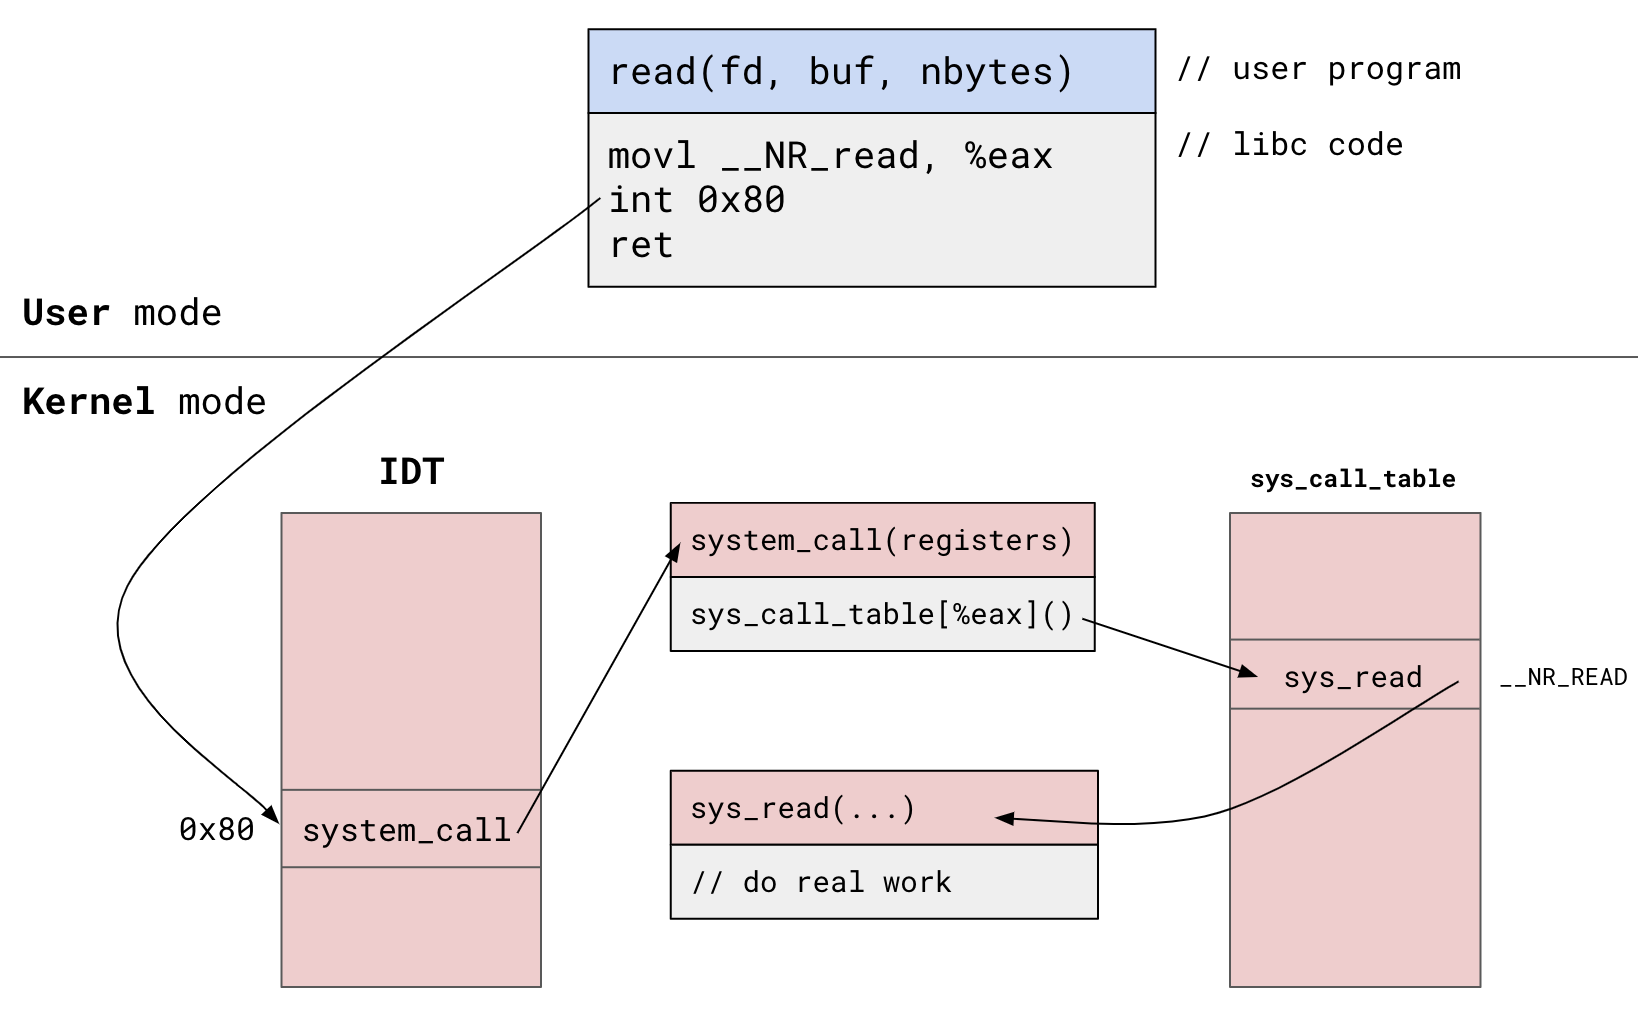
The diagram below illustrates how system calls are invoked in x86-32:

User program invokes read():
- libc system call wrapper invokes software interrupt
0x80(system call)- Places syscall number
__NR_readinto%eaxregister
- Places syscall number
- Trap into kernel mode, look up
0x80in Interrupt Descriptor Table (IDT) - Jump to interrupt
0x80’s handler:system_call() system_call()looks up__NR_readinsys_call_table- Unpack registers, call
__NR_read’s handler:sys_read() - Perform
read()’s real work in kernel’ssys_read()- file entry management, I/O requests, copying data, etc.
int 0x80 was how system calls were invoked in x86-32. x86-64 has a dedicated
syscall instruction so it no longer relies on the software interrupt mechanism
to invoke system calls.
Debugger Breakpoints
Debuggers allow users to stop execution at arbitrary points in the debugged
program by defining “breakpoints”. One way to implement breakpoints in x86 is by
using the int3 instruction as follows:
- Given the address
addrof the code we want to set a breakpoint at, the debugger will replace the byte ataddrwith theint3instruction and save the byte so it can be restored later.- The general form of the
int <code>instruction is encoded using two bytes because the code is specified as a separate operand.int3is a single-byte instruction which allows it to be patched in at arbitrary points in the program code.
- The general form of the
- When the debugged process executes the
int3instruction, a software interrupt is raised that causes the CPU to jump to the debug exception handler. The OS kernel implements this handler by stopping the debugged process and sending it aSIGTRAP. The debugger intercepts theSIGTRAPand regains control, allowing the user to inspect the debugged process’s state.
These breakpoints are known as “software breakpoints” because they are implemented by the debugger using software instructions. Many CPUs offer special debug registers that can be used to implement “hardware breakpoints” (i.e., watchpoints). These are much more powerful than software breakpoints – it allows debuggers to specify memory addresses and what kinds of operations should cause the breakpoint to be triggered (e.g, read/write/execute).
Last updated: 2024-03-18